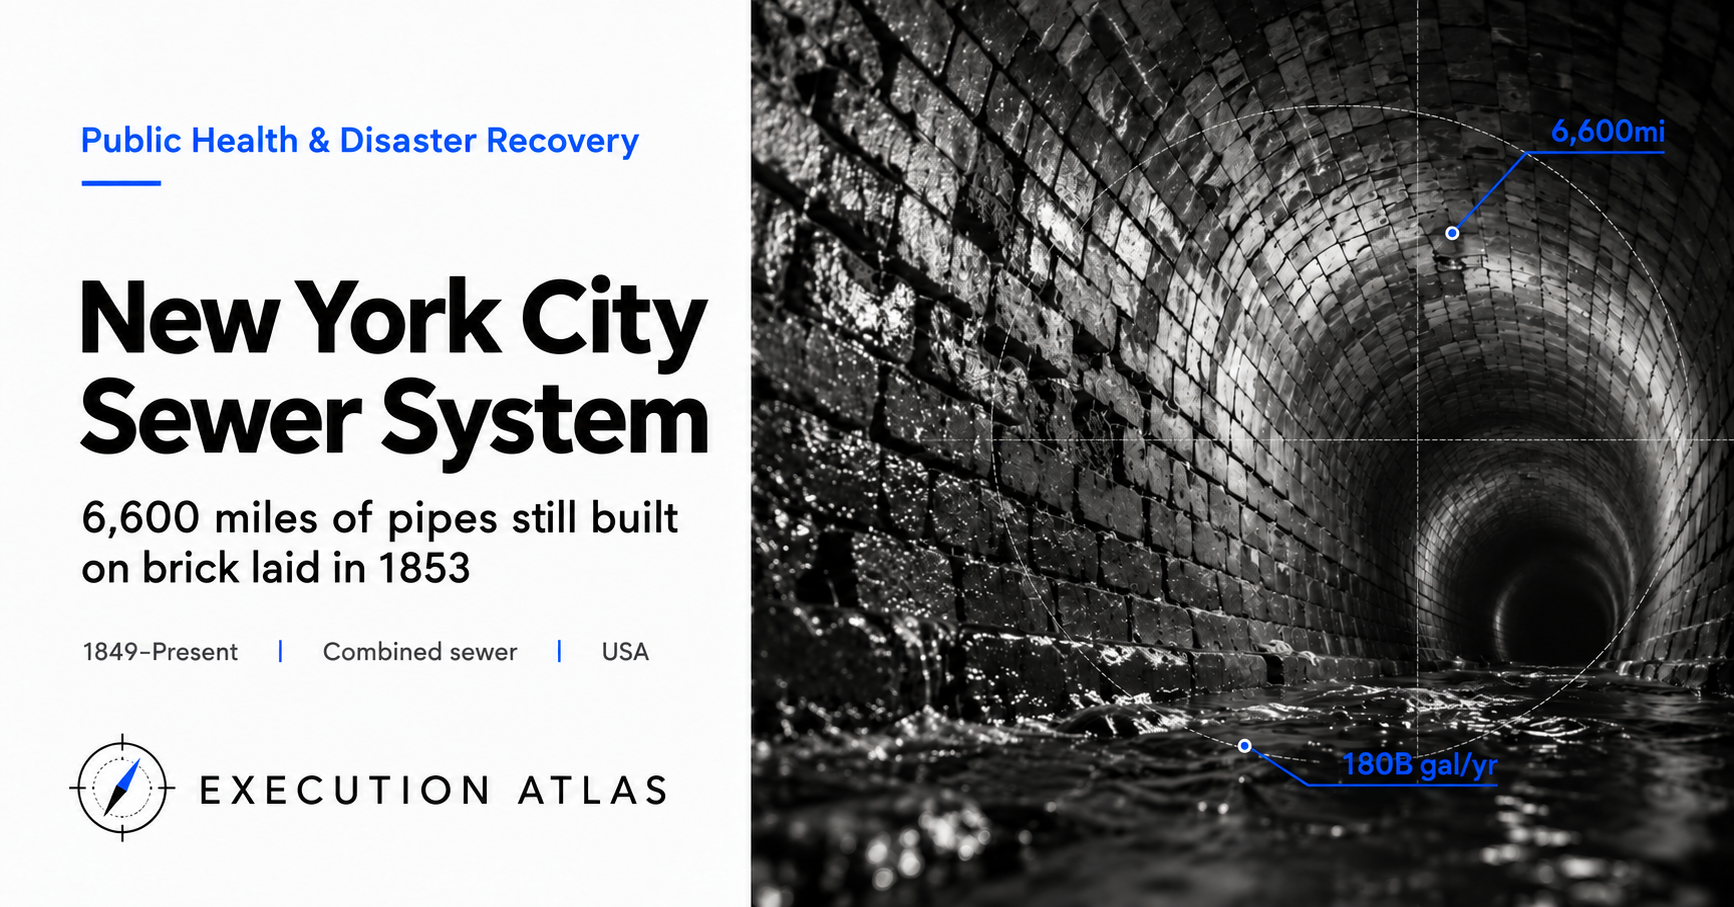
Somewhere beneath Manhattan, directly under the canyon of buildings along Broadway, runs an oval brick tunnel about five feet wide — large enough to walk through. The bricks are reddish-brown, mortar crumbling in spots, dark water trickling underfoot.
That tunnel was sealed in 1853.
Eight years before the Civil War. The year before Edison was born. New York City’s population was about 500,000; people traveled by horse-drawn carriage, and dropping waste into a privy hole in the backyard was perfectly ordinary. Brick sewer pipes laid in that era still carry the waste of 13 million people in 2026.
New York City’s sewer network stretches 6,600 miles — roughly 10,600 kilometers. That’s more than a round trip between Manhattan and Los Angeles. Fourteen treatment plants serve the five boroughs. On a weekday peak, 1.3 billion gallons of sewage and stormwater — about 2,000 Olympic swimming pools — flow through 170 years of patchwork infrastructure every day.
Seventy percent of that system is combined sewers. One pipe carries both sewage and stormwater.
When heavy rain falls, flow exceeds treatment plant capacity and untreated sewage-stormwater mix discharges directly into rivers and sea. About 18 billion gallons per year. That’s eight days’ worth of the city’s drinking water — enough to submerge Central Park under 14 meters of seawater — flowing into the East River and Hudson River annually.
In 2005, the EPA cited New York City for Clean Water Act violations. Since then, the city has invested $2.4 billion in green infrastructure and $1.5 billion in coastal protection. The overflows have not stopped.
The reason they cannot stop is largely that decisions made 170 years ago are still alive today.
Mission: 1849 — 5,000 Cholera Deaths Forced a Decision
In the summer of 1849, New York City held roughly 500,000 people, packed into the southern half of Manhattan Island. Irish famine refugees had flooded in; families of twelve in five-story tenements were unremarkable.
There were essentially no sewers.
What existed was a single covered canal, converted from the Dutch-era ditch dug along Broad Street in 1664, plus privately funded stormwater drains built block by block by merchants. Human waste went into privy pits in backyards; “night soil men” emptied them overnight and carted the contents to the outskirts. Streets were covered in horse manure and garbage; rain washed it all into the low-lying wells.
People drank from those wells.
In May 1849, a cholera patient was identified among European immigrant passengers at the Staten Island quarantine station. The infection spread instantly to Manhattan; by autumn more than 5,000 were dead. Nearly one in four of the city’s deaths that year came from a few months of cholera.
The city had learned nothing from the first cholera epidemic in 1832, which killed 3,500.
This time was different. In the autumn of 1849, the city council established a Sewerage Commission — the first official moment that “building a systematic public sewer” became a stated municipal responsibility.
In London at the time, Edwin Chadwick’s Sanitary Condition of the Labouring Population of Great Britain (1842) was linking sewerage to public health theory. John Snow would not identify the Broad Street pump in Soho until 1854, five years later. New York’s policymakers still believed in the miasma theory — that foul air carried disease.
Even so, hands moved.
In the five years from 1850 to 1855, 70 miles of sewer pipe were laid across the city. About seven feet per day, 14 miles per year. By hand and horse.
The Sewerage Commission chose the combined sewer — one pipe for both stormwater and sewage, flushed together into the river. A natural choice for engineers of the era. Treatment plants hadn’t been invented. Water dilutes in the river. One pipe costs half as much as two. Rain would even wash the stinking streets as a side benefit.
That decision became the origin point for today’s 18 billion gallons of annual overflow.
Design: The City Was Constrained by “No Second Chances”
Translate the design constraints into three modern PM axes.
Timeline: The commission was chased by cholera’s epidemic cycle — 1832, 1849, 1854, 1866. When thousands die in a single outbreak, “take ten years to design it properly” is politically impossible.
Uncertainty: The shift from miasma theory to germ theory came in the 1870s–80s. In 1849, no one knew why cholera spread. The water-disease connection wasn’t confirmed until after Snow in 1854; until Lister proposed surgical antisepsis in 1866, the water-illness link was still hypothesis.
Irreversibility: Manhattan island is layered wetlands and streams over granite bedrock. Once pipe is buried underground, it physically cannot be removed.
Given these three axes, the Sewerage Commission’s choice of combined sewers was rational at the time. The problem came afterward.
In 1865, a citizens’ group called the Citizens’ Association of New York deployed 29 physicians in house-to-house surveys. Their report — Report of the Council of Hygiene and Public Health — ran over 300 pages. It documented density, ventilation, privy conditions, well-water turbidity, and mortality rates by ward. The lead author was Stephen Smith, 42, a surgeon.
The report concluded: “Public health can be purchased. Communities can determine their own death rates.”
In February 1866, the state legislature passed the Metropolitan Health Act, establishing the first municipal board of health in the United States. The board had legal authority to conduct house-to-house inspections, order forced cleanings, close privies, and issue warnings to individual buildings.
That spring, the third cholera epidemic struck New York.
Deaths: 1,200. About a quarter of the 1849 toll.
“Public health is solved by the combination of sewerage and administrative authority.” New York showed the world — and American cities in the 1870s onward adopted essentially the same model.
But the sewers themselves kept expanding as combined systems. By 1900, virtually every household in the city was connected. The combined-sewer network grew with population; not until the 1930s construction of treatment plants was “clean it before you release it” actually implemented.
Nobody stopped the Sewerage Commission’s 1849 decision to standardize on combined sewers. Nobody had reason to. Weighing the cost of tearing out buried pipe against the inefficiency of building only new districts in separate-sewer style, continuation was always cheaper.
Assets fixed over a 150-year scale grow in the direction of their initial decision.
Execution: 14 Treatment Plants and the Invisible Front Line
New York City’s treatment plant construction ran from a provisional facility in 1886 through major expansions in the 1990s — a long-arc project.
The first modern plant was the Coney Island WWTP, completed in 1935, near the southern shore of Brooklyn. It succeeded the city’s first sewage treatment efforts at that site from 1886, built with support from the New Deal’s Public Works Administration. Design capacity: 60 million gallons per day. The 1935 technology was primary treatment only — settling. Secondary biological treatment wasn’t added until the 1950s.
The largest of the 14 plants is Newtown Creek WWTP. Construction began in 1965; operations started in 1967, on the bank of Newtown Creek at the Brooklyn-Queens border. It handles lower Manhattan, eastern Midtown, northern Brooklyn, and western Queens — over a million people’s sewage.
Tracing one number through the plant’s capacity history reveals the difficulty of operating infrastructure without redesigning it.
Dry-weather capacity: 310 million gallons per day (MGD). Rainy-day peak: pre-expansion 620 MGD, extended to 700 MGD after the major expansion that broke ground in 1998. On a rainy day, flow into the plant more than doubles. In a combined system, this is structurally unavoidable.
The expansion took about 16 years and cost roughly $5 billion. It began in 1998, wrapped up in 2014, and proceeded under a federal consent decree — the largest sewer-related investment in the city’s history.
The scheduled duration expanded far beyond initial projections. The dominant driver: retrofitting existing facilities without shutting them down. Because treatment cannot stop for a single day, every upgrade requires three stages — temporary setup, permanent installation, demolition. Adjacent residential neighborhoods and Newtown Creek environmental regulations added further constraints.
One comparison: Chicago’s Stickney Water Reclamation Plant, operating since 1930 and the world’s largest, processes 700 million gallons per day on average. Chicago’s TARP (Tunnel and Reservoir Plan, known informally as “the Deep Tunnel”) takes the approach of drilling massive underground storage tunnels to handle combined sewer overflows — a project started in 1975 and expected to finish in 2029. Total cost: $3.4 billion.
In 2010, New York chose differently.
DEP (Department of Environmental Protection) calculations at the time put an NYC-equivalent TARP at roughly $6.8 billion — 20 to 25 years of work. The alternative: a hybrid of green infrastructure (permeable pavement, rain gardens, green retention areas, green roofs) and conventional construction over 18 years at $2.4 billion.
Mayor Bloomberg and DEP chose the latter. Cost one-third as much; co-benefits (heat island reduction, public space, street trees) made the political case. In 2010 it became a formal settlement agreement with the EPA and New York State DEC.
Status as of late 2025: $1.4 billion of green infrastructure allocated, 668 million gallons per year of CSO reduction. Against a 2030 target of 1.67 billion gallons per year, progress stands at roughly 40%.
The target is generally considered out of reach.
Comparison with an alternate universe is difficult, though. If the $6.8 billion tunnel had been chosen, the project would still be under construction as of 2026, with completion in the late 2030s. The green infrastructure has at minimum delivered something from the $1.4 billion already spent. Viewed as “improvement from existing design rather than comparison to zero,” the evaluation shifts.
People: Stephen Smith — The 42-Year-Old Who Moved a Legislature with 300 Pages
Only one photograph of Stephen Smith circulates widely — taken sometime around 1900. A white-bearded old man. But when he wrote the 1865 survey report, he was 42.
Born in Vermont, graduated from Geneva Medical College. In 1854, he began work as a surgeon at Bellevue Hospital — 27 years old. He treated typhoid and cholera routinely. The concept of surgical antisepsis didn’t exist. Mortality exceeded 50 percent; the cause was not surgery itself but postoperative hospital-acquired infection.
When Smith joined the Citizens’ Association’s Council of Hygiene and Public Health in 1864, he had ten years as a clinician behind him. Not a sewer engineer. Not an urban planner. What he had was a habit of mind: go look at where the patient lives.
The council sent 29 physicians to every ward. More than 30,000 buildings visited. Fields recorded: building structure, ventilation, privy location and condition, distance to wells, household size, and names, ages, and causes of death. One physician per ward; months to complete.
Smith himself walked the Lower East Side. An 1864 autumn entry describes one building: 28 families, 113 people from basement to attic; one privy in the backyard; a well 12 feet away. He transcribed this into the statistical tables of an official document.
The report ran over 300 pages, published in 1865. Each ward’s data appears as the correlation of mortality with housing density. Explanatory framework: not miasma but “overcrowding × unsanitary conditions × water-source contamination.” The transitional logic between miasma theory and germ theory.
Legislators read it. Or more precisely: were made to read it. The Citizens’ Association ran on donations from the wealthy; members of the council included J. P. Morgan’s father and Peter Cooper — powerful city figures. City council was captured by Tammany Hall’s machine, but the state legislature was not.
In February 1866, the state legislature passed the Metropolitan Health Act. Smith was among the board’s founding members. Age 43.
Smith went on to serve as New York City Health Commissioner from 1868 to 1875. In 1872 he co-founded the American Public Health Association and became its first president. In 1875, the New York State Charities Aid Association. He died in August 1922 at 99. In a late interview he said: “We should study health rather than disease. It is not the opposite of disease — it is a different science.”
This is the story of a 42-year-old surgeon who did not build the sewer itself, but created the administrative authority to build it.
One more person did a different kind of work.
Egbert Ludovicus Viele, Army Engineer. In 1865, he published Sanitary & Topographical Map of the City and Island of New York: a visualization of the network of streams and wetlands buried beneath Manhattan. Minetta Creek, Collect Pond, Harlem Creek, Lispenard’s Meadows — all filled in before the Civil War, their traces erased from the surface. A revised edition appeared in 1874 as Topographical Atlas of the City of New York.
Viele reconstructed the map from old survey records and his own fieldwork. For engineers doing underground work, knowing where buried watercourses lie is lifeline information. Groundwater levels, differential settlement, bearing capacity — all determined by the locations of those covered natural channels.
Viele’s map is still used today as a basic reference for New York’s underground infrastructure. The man who made a map in 1865 that would remain useful 150 years later died in 1902 at 76. The underground drainage system he designed for Prospect Park in Brooklyn — in collaboration with Olmsted — is still in operation.
Legacy: Invisible Infrastructure Only Moves When There Are Visible Deaths
On October 29, 2012, Hurricane Sandy struck New York.
The large hurricane tracking north up the East Coast, coinciding with high tide, brought a 14-foot storm surge to Lower Manhattan. The subway flooded; 44 people died. Infrastructure and property damage was estimated at roughly $19 billion.
On the sewer side, 10 of the 14 treatment plants suffered flooding or direct damage. Newtown Creek, Red Hook, North River — electrical systems were inundated, pumps stopped, and sewage and stormwater flowed temporarily untreated into rivers. Recovery took weeks to months.
For the first time, climate change and the 1853 brick pipes were joined together.
New York City’s sewer design was built from 150 years of rainfall and tidal data. 1850s design standards assumed roughly 45 inches of annual rainfall, peak short-duration rainfall around 2 inches per hour, and sea levels a few centimeters lower than today. In 2026: annual rainfall exceeds 50 inches; events exceeding 3 inches per hour are frequent; sea level has risen roughly 12 centimeters.
The physical premises of the design have become invalid.
Sandy did reveal an unexpected form of redundancy — not designed-in resilience but emergent redundancy. Four of the 14 plants sit farther inland — North River, Wards Island, Hunts Point, partial functions at Oakwood Beach — and escaped flooding. The “distribute plants across the borough” decision made during 1931–1950s plant construction turned out to matter during the disaster.
If treatment had been consolidated at a single Newtown Creek facility, the city’s entire sewage processing would have halted.
The reason for choosing distributed facilities wasn’t disaster resilience. 1930s–50s decision-making was driven by spreading construction budgets across multiple municipal budgets and federal grants, and balancing political representation across the boroughs. That outcome functioned in 2012.
After Sandy, the city launched three investments simultaneously.
First, waterproofing individual treatment plants: raising electrical systems to above 14 feet, elevating switchboards, adding pump redundancy. Completed 2015–2020, roughly $3 billion.
Second, coastal protection in the form of the Big U, also known as the East Side Coastal Resiliency (ESCR): a 10-mile protective barrier around Lower Manhattan, designed in integration with sewer outfalls. Officially broke ground 2018; construction continues as of 2026. Total cost roughly $1.5 billion.
Third, accelerated green infrastructure: an extension of the 2010 plan targeting 1.67 billion gallons per year of CSO reduction by 2030.
All three running simultaneously. The basic principle of invisible infrastructure remains unchanged.
“Sewer budgets only appear when there are visible deaths.”
1849 cholera: 5,000. Third cholera epidemic 1866: 1,200. Sandy 2012: 44. In each case, visible death justified investment. Routine deterioration — 18 billion annual gallons of CSO, 1853 brick-pipe degradation, climate-driven shift in precipitation patterns — progresses daily but doesn’t make news. No funding appears.
What Smith’s 1865 report demonstrated was not sewers themselves but “the technique of translating invisible things into visible form.” Three hundred pages of house-by-house records were the first attempt to translate miasma into numbers. Twenty-first-century New York’s sewer system is waiting for someone to do the same thing again — a different report, a different Smith.
Not yet arrived.
Takeaways
New York City’s sewer system is the longest-running demonstration of a fact: “You cannot design a 150-year infrastructure correctly on the first try.”
The 1849 Sewerage Commission chose the combined sewer — a reasonable decision under the pressure of 5,000 cholera deaths, without treatment plant technology, for a city of 500,000. The problem is that decision survived through 1900’s 3 million, 1950’s 8 million, and 2026’s 8.5 million residents plus 1.6 million daily commuters.
There is a concept called Asset Fixity. Pipes and treatment plants buried underground cannot physically be moved. The degrees of freedom in decision-making shrink over time. The 1849 judgment became “already too late” by 1900; “carrying a structure in violation of the law” when the Clean Water Act passed in 1972; “reaching the same goal by a different route” in 2010.
“Changing the route without changing the goal” is the technology of the 2010 green infrastructure pivot.
The $6.8 billion tunnel-storage approach (Chicago’s TARP method) was replaced with $2.4 billion of green infrastructure. The consent decree was renegotiated with the EPA and state DEC — the federal regulatory frame was left intact; only the means of achieving it were redesigned. Cost dropped to one-third; political appeal increased; co-benefits (heat island reduction, urban parks) strengthened the budget justification. A textbook example of “getting it cheaper without making enemies of existing regulation.”
But progress at end of 2025 was roughly 40 percent. The 2030 target appears out of reach. Another reading: “By changing the route, we lost certainty.” Tunnel storage reliably stores water. Green infrastructure reduces runoff on clear-ish days but doesn’t necessarily absorb rainfall peaks in a downpour.
A pattern that appears frequently in long-asset decision-making:
Early phase: degrees of freedom are high, but data is sparse.
Middle phase: data has accumulated, but Asset Fixity has consumed the degrees of freedom.
Late phase: paying the accumulated cost of past decisions.
What New York’s sewers show is that these three phases appeared in 1849, 1930, and 2010 — separately. Decision-makers in each era could not tell in real time whether they were in the “early,” “middle,” or “late” phase. Looking back 150 years later, 1849 was early; by the 1972 Clean Water Act, already middle; 2010’s green infrastructure pivot was late-phase redesign under capital scarcity.
One more problem: invisibility.
What Smith did in 1865 was not build sewers. It was to compile ward-by-ward housing density and mortality data into 300 pages and place it before the legislature in visible form. He translated the concept of miasma into a numerical model of “overcrowding × water-source contamination × mortality.” That became the legislative basis for the Metropolitan Board of Health.
That same translation hasn’t been done in 2026.
18 billion annual gallons of CSO, the fraction of remaining 1853 brick pipe, climate-driven changes in precipitation patterns, sea-level rise effects on treatment plants — each exists as isolated statistics. But nothing has been assembled in the form Smith’s report took — “the form that moves a legislature.” Until the next Sandy-scale hurricane, with visible casualties, nothing will probably move.
This pattern is not unique to sewers. Aging bridges, the power grid, cybersecurity — all share the structure of “budgets only appear after accidents.”
When viewing your own project through the lens of long-lived assets, three questions organize the inquiry:
- Will people 150 years from now see today’s design as “the high-freedom early phase” or “the accumulating-cost middle phase”?
- How quickly is the irreversibility (Asset Fixity) of this decision growing?
- If no visible crisis arrives, can the investment be justified? If not, what needs to be translated into visible form?
Smith’s answer was 300 pages.
Sources
- Smith, Stephen et al., Report of the Council of Hygiene and Public Health of the Citizens’ Association of New York (1865) — 300-page house-to-house survey; legislative basis for the Metropolitan Board of Health.
- NYC Department of Environmental Protection, “NYC Wastewater Treatment System” (official statistics) — 6,600 miles, 14 treatment plants, operations overview.
- New York State Department of Environmental Conservation, “NYC CSO Program” (https://dec.ny.gov/environmental-protection/water/cso/nyc-cso) — 398 outfalls, estimated 18 billion gallons annual CSO.
- EPA, “CSO Control Policy” (1994) and the 2005 Clean Water Act violation citation.
- NYC DEP, “Green Infrastructure Annual Report 2021 / 2025” (https://www.nyc.gov/site/dep/water/green-infrastructure.page) — $2.4B 18-year plan; 2025 year-end results.
- Rebuild by Design, “The Big U” (https://rebuildbydesign.org/work/funded-projects/the-big-u/) — 10-mile coastal protection concept.
- Jacobs Engineering, “East Side Coastal Resilience Program” — Sandy damage and ESCR scope (including sewer outfall integration).
- Baruch College NYCdata, “Cholera 1849 / 1866” (https://www.baruch.cuny.edu/nycdata/disasters/) — mortality statistics.
- Viele, Egbert L., Topographical Atlas of the City of New York (1865) — map of Manhattan’s buried watercourses; basic reference for underground construction.
- Burrows, Edwin G. and Mike Wallace, Gotham: A History of New York City to 1898 (Oxford University Press, 1999) — 19th-century New York urban history.
- Gotham Gazette, “The Sewer System” (2005) — overview of NYC sewer system management challenges.