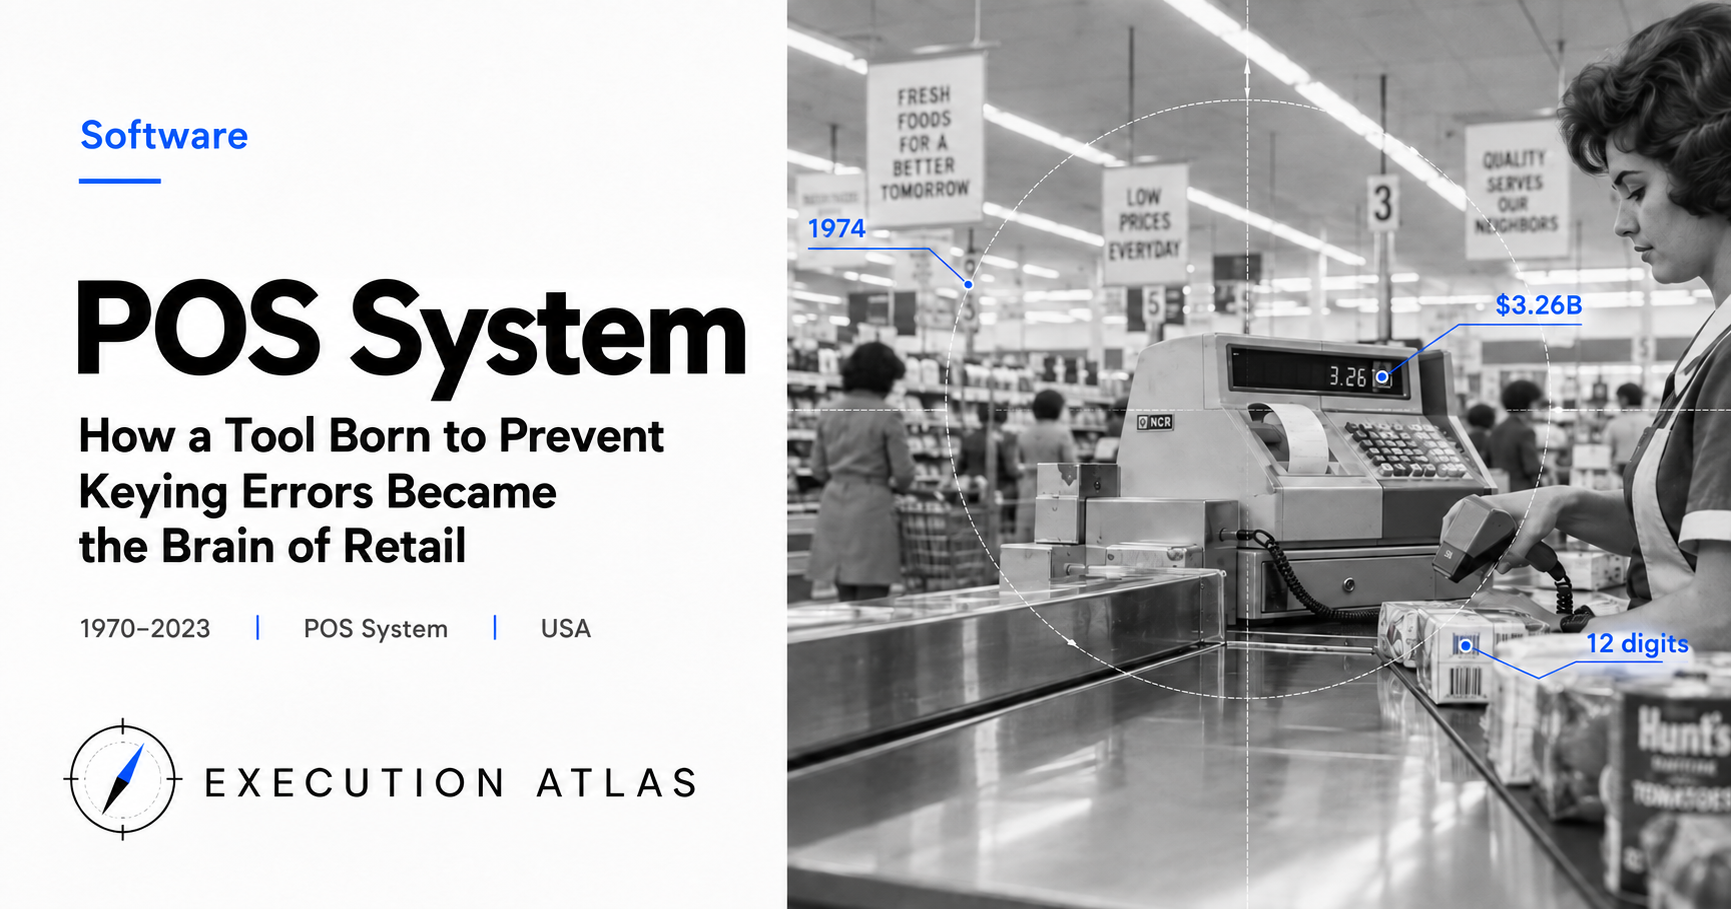
June 26, 1974, 8:01 a.m. At Marsh Supermarket in Troy, Ohio, a man named Clyde Dawson placed a single pack of Wrigley’s Juicy Fruit gum on the checkout counter.
The cashier passed it under a scanner. A beep. Sixty-seven cents appeared on the display. It was the first moment a UPC barcode was ever read in a commercial setting.
That pack of gum now sits in the Smithsonian Institution.
Half a century later, that same barcode technology is stamped on pharmaceuticals, electronics, and library books, while sole proprietors turn their smartphones into cash registers for a few dollars a month. The global cloud POS market reached $3.26 billion in 2023 and is projected to hit $30 billion by 2034.
But this article is not about how barcode scanners and cash registers went digital.
It is about how something called a POS system has, in substance, been reborn as an entirely different project three times. A device invented in 1970s America as a “typo-prevention machine” was redefined in Japan in 1982 as a “marketing tool,” and replaced in San Francisco in 2009 by a “movement to make payment terminals free.” The hardware was swapped out at each stage, but every transition shared one feature: each disrupted an existing order by using the same device in a different way.
Mission: The Profits Leaking Behind the Register
Late 1960s America. Supermarkets had already grown enormous. A single store handled thousands to ten thousand SKUs, checkout lines stretched long, and cash-register errors by cashiers were a constant headache for owners.
Three problems compounded each other: pricing accuracy, inventory visibility, and register throughput.
Of the three, the cash-error problem was the most urgent. Cashiers typed in prices by hand. Out of thousands of transactions a day, dozens contained mistakes. Most errors worked against the store. Revenue leakage of 0.5–1% of sales was normal. For a supermarket operating on single-digit gross margins, that was an existential number.
Two register manufacturers stepped up to the challenge: NCR and IBM.
NCR was founded in 1884 as a dedicated register maker, the company that brought mechanical cash registers to the world and led the industry through the twentieth century. IBM was the mainframe giant of computing. Around 1970, both companies converged on the same question: could a register be connected to a central computer?
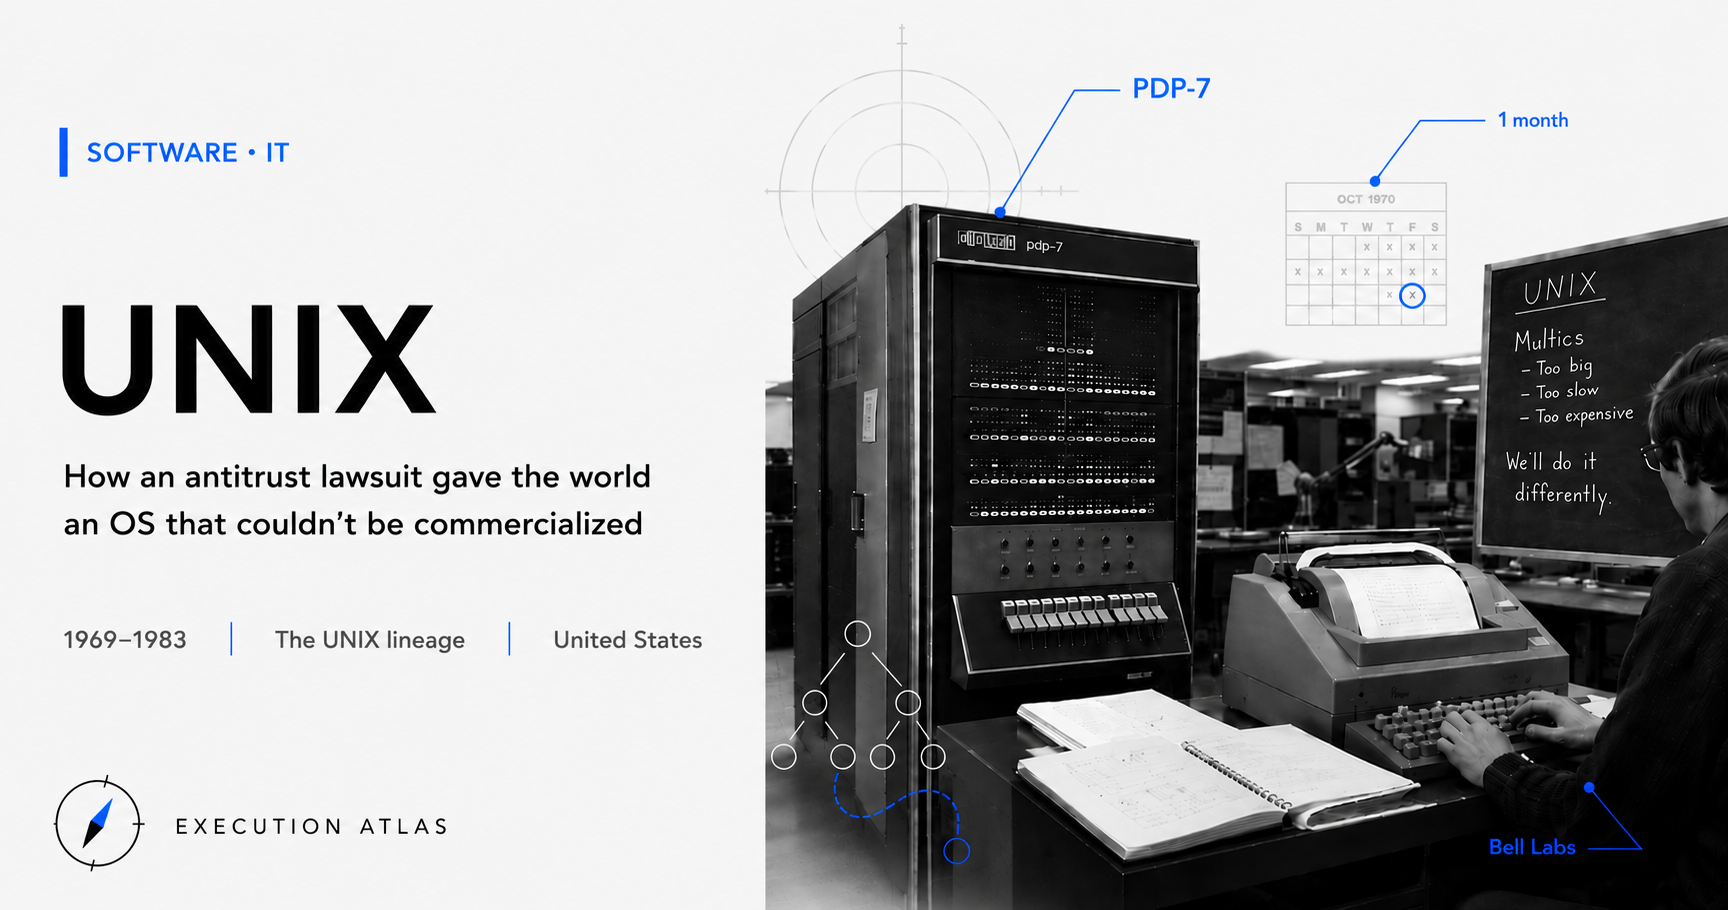
NCR moved first. In 1970, it launched the NCR 280 Retail Terminal — the industry’s first bidirectional online POS, sending full transaction records to an in-store server and generating sales reports automatically. In 1971, the NCR 230 ECR, the world’s first electronic cash register, followed.
The mission at this stage was clear: eliminate cashier errors; collect sales totals accurately. Nothing more, nothing less. The idea of using data for “business decisions” still lay outside the frame of the conversation.
Design: Bull’s-Eye or Rectangle?
Even with a POS connecting the register to a back-end system, the hardware alone couldn’t identify products. As long as a cashier read a price tag and typed in the amount, errors would persist.
What was needed was a machine-readable identifier printed directly on product packaging.
In the early 1970s, the U.S. food industry worked collectively to define the Universal Product Code (UPC). Two companies brought competing proposals to the committee: RCA and IBM. Their proposed shapes could not have been more different.
RCA proposed a bull’s-eye — concentric circular bars. Its advantage was omnidirectionality: no matter what angle the scanner approached, it could return a value.
IBM proposed a twelve-digit rectangle. IBM engineer George Laurer designed it: a narrow vertical strip containing parallel vertical lines.
In a conference room, the bull’s-eye might have won. The directionless-scanning elegance feels intuitively “smart.”
What decided the outcome was a physical constraint on the factory floor.
Food packaging is produced on high-speed offset presses. Paper is pressed against a rotating plate and ink transfers. In this process, circular plates allow ink to spread slightly. In 1974’s printing technology, there was no guarantee that a circle would stay circular after printing.
Vertical lines, on the other hand, remained readable even when ink spread a little. Laurer had confirmed this through thousands of experiments.
There was a second reason Laurer’s design won. Because the twelve-digit rectangle was built from vertical lines arranged in a row, it could be printed at an extremely small size. A bull’s-eye, being concentric circles, required a minimum diameter.
Smaller printing area meant smaller products could be accommodated. Gum. Lighters. Snacks. The small packaging that made up 80% of a supermarket’s shelf.
In 1973, the U.S. food industry adopted the IBM proposal. The twelve-digit rectangle became the global standard.
What Laurer chose that day was not the “ideal” — it was the constraint of the printing floor. The bull’s-eye was more mathematically elegant, but the design that could actually pass through production won.
Execution: Gum, Tatsumi Chain, and Toshifumi Suzuki
From the finalization of the UPC standard to implementation took just over a year. On the morning of June 26, 1974, Marsh Supermarket in Troy, Ohio, was chosen as the site.
Why Marsh? It had been offered as an industry test site. Why gum?
Clyde Dawson, Marsh Supermarkets’ director of research and development, later said he chose the gum out of respect for Wrigley. Wrigley had put in considerable internal effort testing whether UPC barcodes could be printed on a small gum package. The choice was a gesture of appreciation for that effort.
It was also a technically perfect demonstration. If the world’s first scan had chosen a product “too small to print on,” UPC adoption might have been limited to a subset of supermarket goods. If gum could be scanned, anything could.
The choice of one product for an initial demonstration declared the technology’s entire scope of application.
Five years later, the same wave began in Japan. The JAN code (Japan’s barcode standard) was established in 1978, and in 1979, the Tatsumi Chain conducted Japan’s first in-store scanning experiment using the NCR 255/6060 system.
Japan’s POS up to this point had followed in America’s footsteps. The use case was the same: eliminating cashier errors and automating sales tallying.
In October 1982, that changed.
Seven-Eleven Japan began deploying POS systems across all its stores. The executive driving it was then-Vice President Toshifumi Suzuki. By 1983, the rollout was complete across the entire chain. Both the number of units deployed and the capital invested were, by the standards of the time, on an entirely different scale.
What fundamentally differed from the American approach was how Suzuki saw the POS — as a different tool altogether.
In the U.S., POS was a device for checkout and reporting. Other Japanese chains shared that view. Suzuki redefined POS as “a marketing device for running daily hypothesis-testing on individual SKU demand.”
In practice, it worked like this. Every product code and transaction time was recorded in the POS. The next day, store ordering staff — including part-time employees on the floor — reviewed that data. How many umbrellas sold today? What does the weather forecast say about tomorrow? Compared to a day with the same location and temperature, were today’s sales strong or weak?
Observe. Form a hypothesis. Place an order. The next day, the result comes back as data. Numbers confirm whether the hypothesis was right or wrong.
Suzuki called this daily cycle of “hypothesis → order → verification” tanpin kanri — single-item management. The U.S. had never taken the idea of drilling POS data this granularly into floor-level decision-making.
Multiple sources agree: Seven-Eleven was the first in the world to use POS data for marketing. The hardware was the same NCR-lineage system. The operating philosophy was different.
In America, the span from NCR 280’s 1970 launch to the 1974 first scan was four years. In Japan, from JAN’s 1978 establishment to Seven-Eleven’s 1983 full-chain rollout was five years. Deployment itself moved quickly. But the invention of how to use it came ten years later.
People: Four Designers Across Time and Place
This project has four designers separated by decades and continents.
George Laurer. IBM engineer. In the early 1970s, he designed the twelve-digit rectangular UPC. A pragmatist who ruled out the bull’s-eye on two axes — print area and print precision. His training was to prioritize mass-producibility over design elegance. His later interviews are almost entirely free of abstract design philosophy. He talks about bar width, spacing, ink, scanning angles — concrete specifics.
Clyde Dawson. Research and development director at Marsh Supermarkets. The person who performed the first scan at 8:01 a.m. on June 26, 1974. He chose gum out of respect for Wrigley; that choice inadvertently declared the scope of UPC’s applicability. A classic example of the gap between what a historical actor was conscious of and the meaning that survives them.
Toshifumi Suzuki. Born 1932, age 50 at the time. Economics graduate of Chuo University. Built his career at Tokyo Shuppan Hanbai (now Tohan), then joined Ito-Yokado in 1963. In 1973 he led the negotiations for Seven-Eleven’s Japan franchise, opening the first store in 1974. He became president in 1978. By 1982 when he decided to deploy POS, he was running Japan’s largest convenience-store chain.
Suzuki’s view of POS was unusual for its time. In 1982, POS still carried the image of an expensive checkout machine, and investment-return discussions stayed within the frame of “reducing errors” and “improving register throughput.” Suzuki was asking a different question: “How many SKUs per store per week are turning into dead inventory? If we identify dead items faster and pull them from the shelf, how much margin is freed up?” Same investment, different benefit.
Jack Dorsey and Jim McKelvey. The two co-founders of Square, 2009. Dorsey was already well known as a Twitter co-founder. McKelvey was a glassblower by trade; since 2002 he had run Third Degree Glass Factory in St. Louis. One day, he tried to sell a handmade glass faucet handle and fitting for $2,000, but had no way to accept a card payment and lost the transaction. At the time, card terminals came with heavy monthly fixed fees and merchant charges that put them out of reach for individual sellers.
McKelvey told Dorsey the story. They built a prototype: a small card reader that plugged into a smartphone’s headphone jack. Cost to build: 97 cents.
Square was founded in 2009 and launched its service in 2010. An era began in which anyone could acquire payment hardware for a few dollars. The POS infrastructure that had previously existed only between large retailers and payment networks descended to food trucks, flea markets, and individual salons.
McKelvey’s origin was his lived experience as a glassblower. An ordinary small failure — unable to sell a product because he couldn’t accept payment — became, ten years later, a $20 billion company.
Legacy: A Four-Order-of-Magnitude Price Collapse
Here are some numbers.
POS deployment costs in the 1970s. The dominant configuration placed a host computer in each store; large stores could run to hundreds of millions of yen in total. Mid-sized supermarkets routinely spent tens of millions of yen.
Cloud POS in 2025. Services like Square, Shopify POS, Toast, and Lightspeed offer hardware in the range of tens of thousands of yen, monthly subscriptions for a few thousand yen, and transaction fees of a few percent of sales. A sole proprietor can deploy on opening day.
Over 50 years, entry cost fell by four orders of magnitude.
The global cloud POS market reached approximately $3.26 billion in 2023. Growing at an annual rate of 18–24%, it is projected to reach $30 billion by 2034. Japan’s cloud POS market is also forecast to expand roughly tenfold between 2025 and 2036.
A four-order-of-magnitude drop in entry cost means the long tail of the market has been unlocked. A sole-proprietor shop doing ¥10 million in annual revenue uses the same POS infrastructure as a major chain, for a few thousand yen a month. They review SKU-level sales data daily and adjust orders and assortment on the fly. The tanpin kanri that Toshifumi Suzuki pioneered at the cutting edge of the world in 1982 is now the default equipment for individual business owners.
One more layer.
The uses of POS-accumulated data have expanded too. What started as in-store inventory management flowed into supplier production planning, and now extends into manufacturer new-product development, financial institution credit assessment, and regional economic statistics. POS data is shifting from “the brain of retail” to “a sensor for the economy.”
The technology that began with one pack of gum on June 26, 1974, is now both the infrastructure of global retail and an instrument for observing the economy.
Takeaway: Redefining the Same Tool Lets a Project Be Born Again and Again
Of the lessons 55 years of POS systems offer, here is the sharpest one.
Rewrite the purpose of the same tool and you get a different project. And it tends to scale larger.
POS has had its purpose rewritten at least three times.
The first rewrite came in 1970s America. NCR and IBM built POS around the missions of “eliminating cashier typos” and “automating sales tallying.” The POS of this era was an operational efficiency tool — essentially an extension of accounting software.
The second came in 1982 Japan. Toshifumi Suzuki redefined the same hardware as “a marketing device for running daily hypothesis-testing cycles.” The hardware did not change. The operating philosophy did. Seven-Eleven went on to sustain high profitability in Japanese retail for decades, and tanpin kanri became the standard for domestic chains.
The third came in 2009 San Francisco. Dorsey and McKelvey replaced the premise that “payment terminals are expensive equipment that merchants purchase” with “plug it into a smartphone.” The hardware changed. But the POS framework itself remained — in fact, its entry cost fell by four orders of magnitude.
In all three cases, the incumbent players could not see it coming.
The first designers (NCR/IBM) did not anticipate that a Japanese convenience store would use POS data as a marketing device twenty years later. The second redefiner (Suzuki) did not predict that payment terminals would effectively become free thirty years later. The third entrepreneurs (Dorsey/McKelvey) did not foresee that POS data would become training material for AI ten years later.
The participants at each stage were simply solving the problem in front of them. But by changing the frame of how they solved it, they laid the groundwork for the next stage.
The question this surfaces is not “choose the right answer.”
If you used the tool in your hands at a different layer than you use it today, what could you do?
Consider accounting software. Today it is a tool for bookkeeping and filing returns. But it records every daily sale and expense. If you repurposed that data as a daily decision-making dashboard, what would you see? Or if you fed it to an AI to forecast next month’s cash flow, what could you do?
Consider Slack. Today it is a chat tool. But it holds the log of every communication in an organization. If you repurposed that log as a bottleneck-detection device, you might be able to see which teams are slowing down decision-making.
Rewrite the purpose of the same tool and you get a different project.
And the person who rewrites it becomes the winner of the next decade.
When Toshifumi Suzuki invented tanpin kanri, he was not a hardware engineer. When McKelvey conceived Square, he was not an engineer — he was a glassblower. Purpose rewrites do not necessarily come from technologists or large corporations. More often they come from someone on the ground who is frustrated with the existing way of doing things.
The gum chosen in 1974 was selected as a small gesture of respect for Wrigley. No one anticipated that it would become the first demonstration of a tool that would generate a $30 billion market half a century later.
That kind of small choice, in hindsight, turns out to be a turning point.
Sources
- History Channel, “Pack of Chewing Gum Becomes First-Ever Item Scanned With a UPC Barcode | June 26, 1974” — first scan date/time (1974/6/26 8:01), location (Marsh Supermarket, Troy, OH), Clyde Dawson, and the rationale for choosing Wrigley’s
- Home Grown Great, “50th Scanniversary: A History of the First UPC Barcode Scan” — George Laurer’s shift from bull’s-eye to twelve-digit rectangle and the printing-constraint background
- NCR Japan Commerce, “Register Chronology” — NCR 280 Retail Terminal (1970) and NCR 230 ECR (1971) release years and specifications
- Onamae.com Business Concierge, “The History of POS Systems” — UPC (1973), EAN (1977), JAN (1978) establishment dates; Tatsumi Chain (1979) Japan’s first JAN scanning
- Wikipedia, “Toshifumi Suzuki” — Seven-Eleven POS rollout timing (started October 1982, full chain complete 1983), tanpin kanri philosophy, designation as world’s first POS-data marketing use
- Forbes Japan, “From a 97-cent Prototype: The Founding Story of $20-Billion Square” — Jack Dorsey and Jim McKelvey’s Square founding (2009), the 97-cent prototype, McKelvey’s lived experience as a glassblower
- Weekly ASCII, “Jack Dorsey, Co-founder of Twitter and Square, Talks Mobile Payments” — Square’s mission and impact on small business owners
- GII Market Research, “Cloud POS Market Research” — global cloud POS market 2023 estimate $3.26 billion, CAGR 24.1%
- Fortune Business Insights, “Cloud Point-of-Sale (POS) Market Size, 2034 Forecast” — 2034 market size forecast $30.04 billion